EIVEE - Activity-Based Calculator
( Case study )
Enhancing Corporate Carbon Accounting Accuracy with Activity-Based Calculator at Eivee
Eivee faced significant challenges in accurately assessing and managing its carbon emissions. The existing carbon accounting methods provided a broad overview but lacked the detail necessary to identify specific high-emission activities. This lack of granularity prevented the company from implementing effective and targeted emission reduction strategies.
Challenge
The solution involved designing and integrating the Activity-Based Calculator (ABC) into the existing Carbon Accounting module. This new feature ensures a more accurate representation of emissions, particularly for activities directly correlated with emissions, such as fuel consumption and production output. The ABC focuses on enhancing the accuracy and granularity of emission calculations, providing a more detailed analysis of emission sources.
Solution
UI design, User research, Wireframes and Prototypes, Cross-functional collaboration, Iterative Design, Usability testing
Service
Discovery & Research Methods
Desk Research
Desk research played a crucial role in the Discovery & Research Methods phase. It provided essential insights into existing solutions, competitor offerings, market trends, and user preferences. This informed the identification and prioritization of user needs, facilitating the design of effective solutions. Overall, desk research was essential for synthesizing insights, guiding design decisions, and ensuring the creation of a successful product.
Card sorting results for the flow map of the calculator
Through engaging users in card sorting exercises, we identified the activities or features that are most important to them. This process enables us to prioritize content and functionalities in the flow map, ensuring that the most critical elements are easily accessible and prominently featured.
Competitor Analysis
Through our analysis of competitors, we gained insights into the expectations users have for similar products or services. This understanding guided us in designing a solution that not only meets but exceeds these expectations, ultimately enhancing user satisfaction and fostering retention in the future.
Ideation
Brainstorming session on visual design and concept ideas
During the brainstorming session, I explored a range of ideas and concepts for the activity-based calculator design. It was a dynamic exchange of creativity and collaboration, with each team member contributing unique insights. We embraced diverse perspectives and iterated on ideas, refining them as we went. The session was a pivotal step in the design process, fostering creativity and laying the foundation for a compelling and user-centric design.
User flow diagram creation
The user flow diagram carefully mapped out the sequence of user interactions and decision points. This visualization helped interpret the quality of the user's path and revealed their preferred pathways to solve pain points. The diagram guided the design process, prioritizing key interactions and streamlining the user flow. Throughout iterations, it facilitated communication and collaboration, ensuring the final web product met user needs effectively.
Early stage of components creation
Wireframes
Prototyping and Testing
After completing the initial design phase of our product, we proceeded to provide a demo prototype to both internal and external stakeholders for feedback and validation. The demo prototype showcased the core features and functionalities of the product, allowing stakeholders to interact with the interface and experience the intended user journey firsthand.
Following the distribution of the demo prototype, we conducted usability testing sessions with a diverse group of participants, both internally and externally. During these sessions, participants were asked to perform specific tasks within the prototype while providing feedback on their experience, including usability, navigation, and overall satisfaction.
The results of the usability testing were primarily positive, with participants expressing enthusiasm for the product's functionality, ease of use, and potential value. Key strengths identified included intuitive navigation, clear visual cues, and seamless interaction patterns, all of which contributed to a positive user experience.
Based on the positive feedback from usability testing, we proceeded to the next step of finalising the final look and feel of the product.
Final Web Product Design
Creating Reusable Components
In creating the activity-based calculator, I used Figma to carefully design reusable components like input fields and display elements. This helped maintain consistency across the entire product. With a strong design system in place, I ensured easy scalability and collaboration among team members. This reflects my commitment to delivering quality design solutions.
Final Design Solution
Intuitive Layout and Visual Hierarchy
Feature: Clean interface with a sidebar, kanban-style task management, and a floating "Create Task" button from the admin view. Tasks are organized in "To Do," "In Progress," and "Done" columns.
Benefit: Enhances user understanding and reduces cognitive load by visually categorizing tasks and information. The sidebar ensures easy navigation, while the kanban board provides a clear overview of task status. The floating button simplifies task creation, making the interface user-friendly and efficient for administrators.
Interactive and Contextual Input Fields
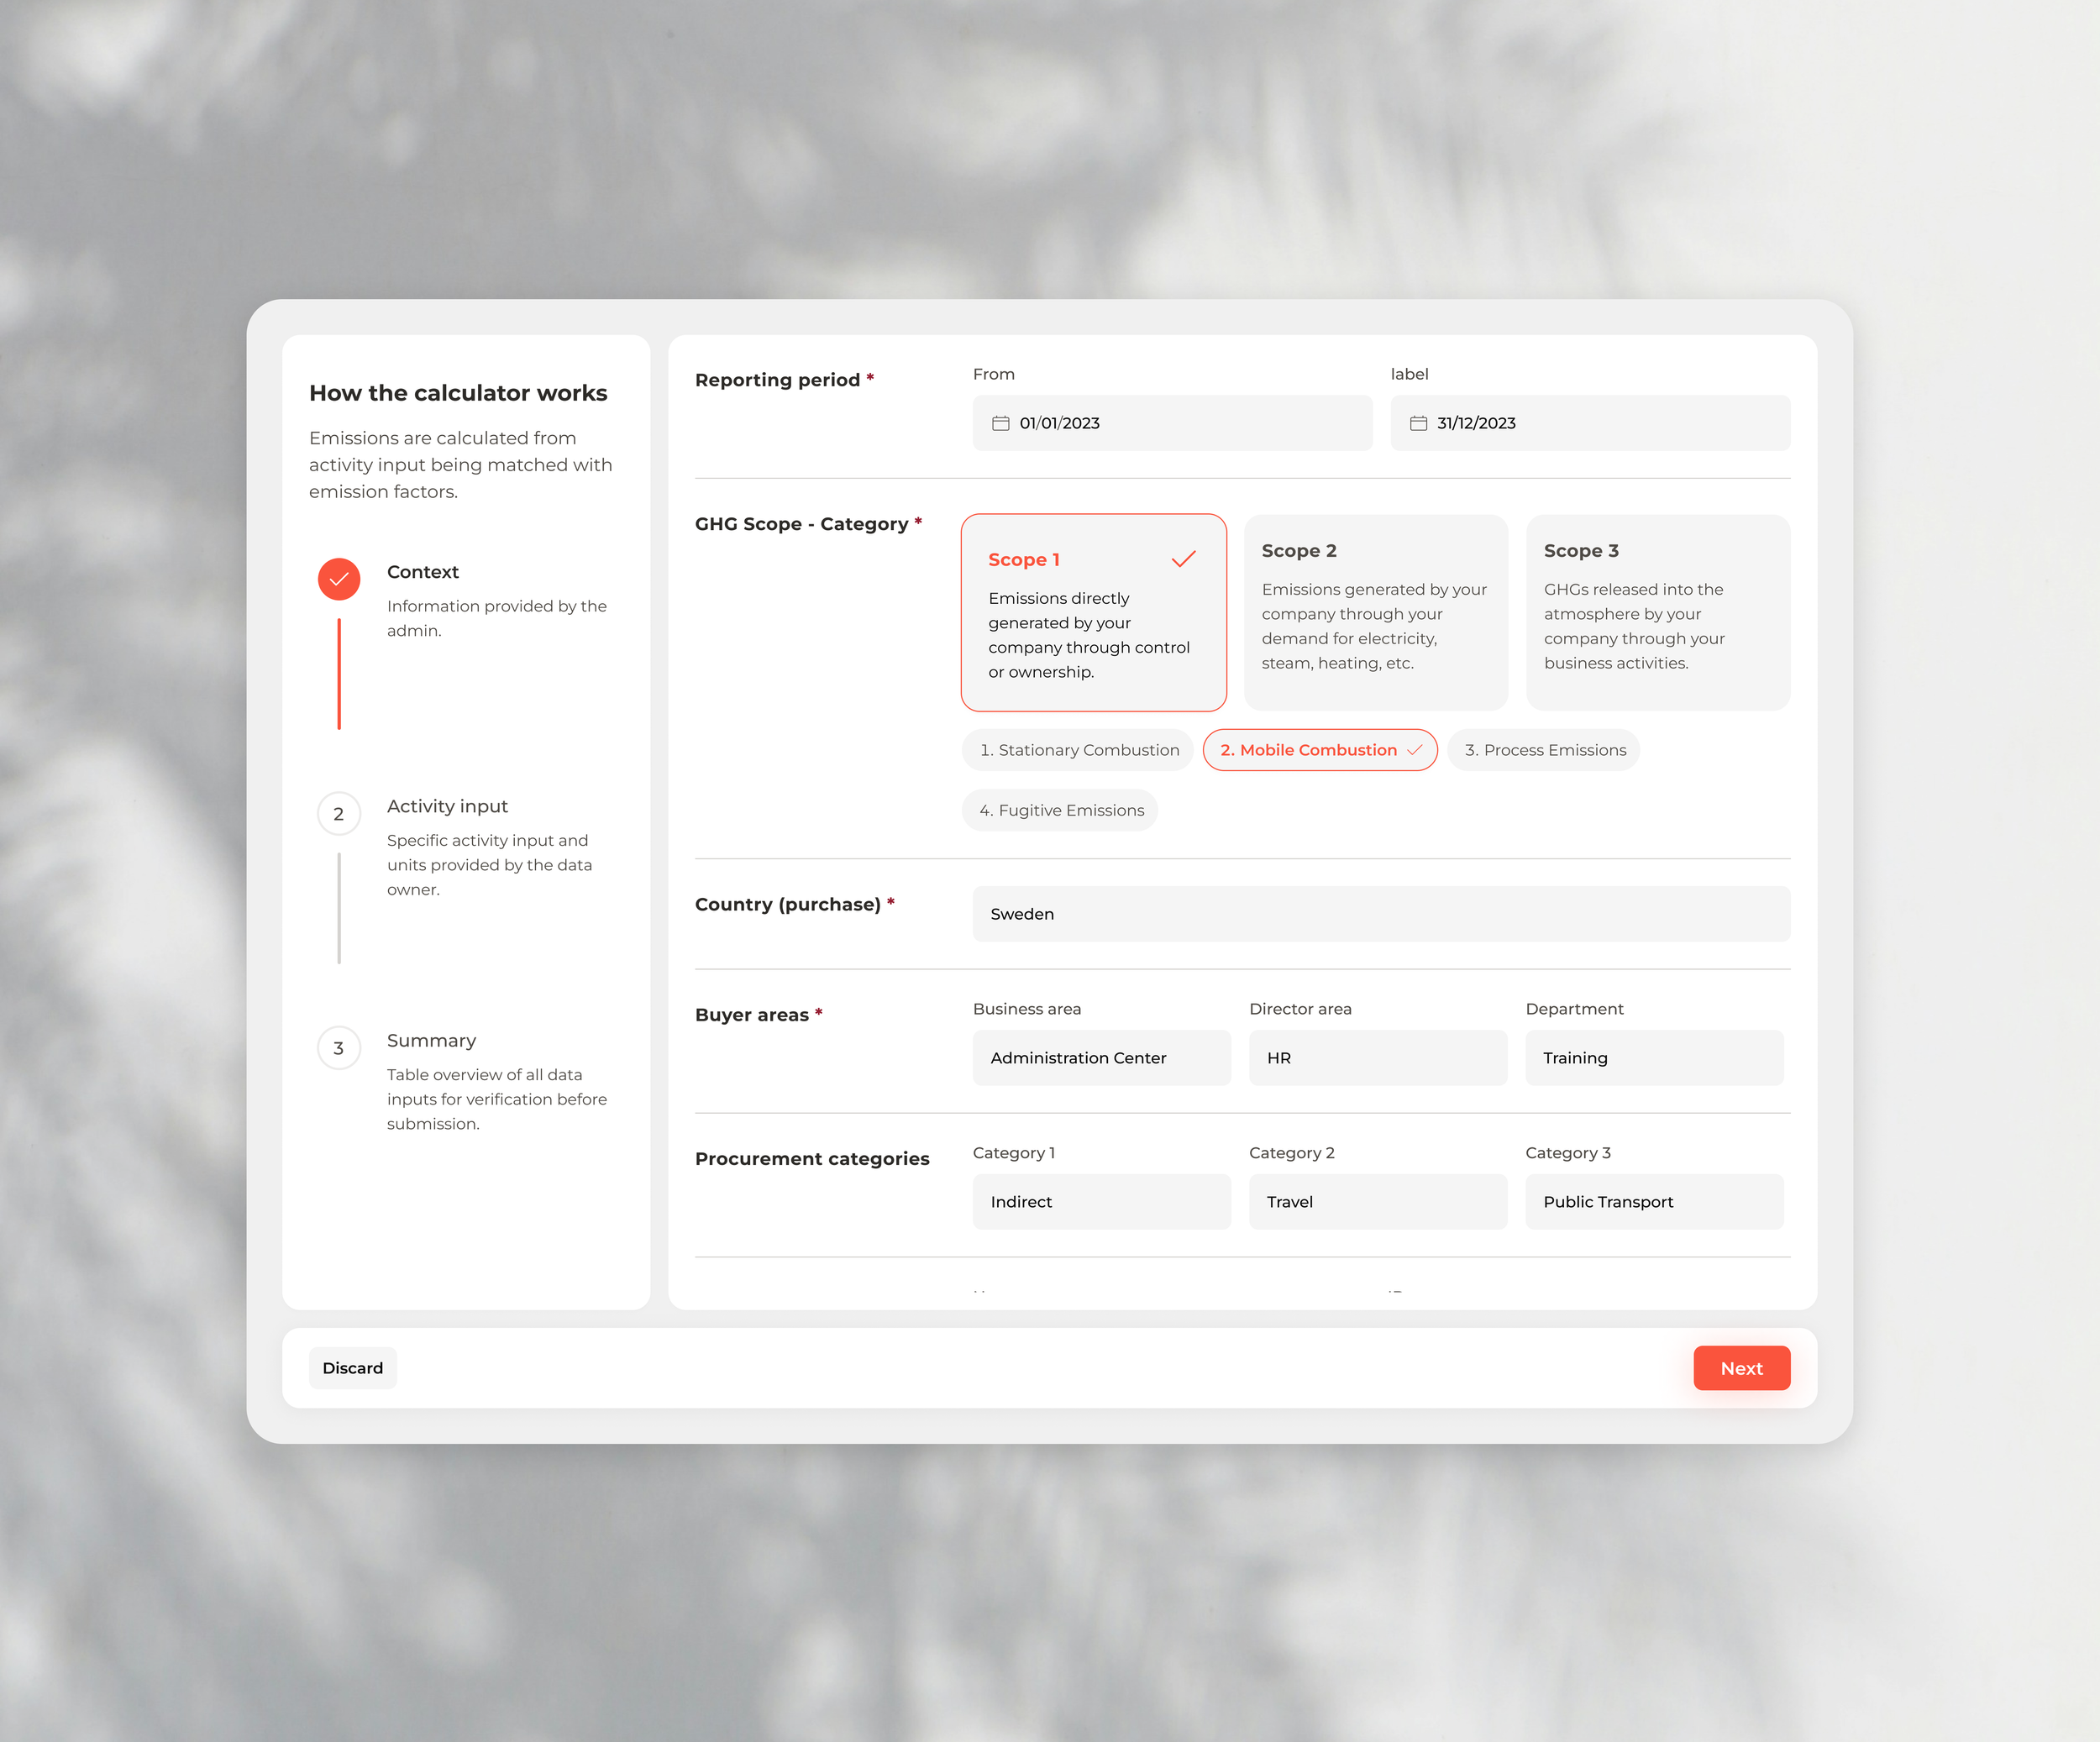
Feature: Interactive fields with examples and dropdowns for task creation. Includes sections for reporting period, GHG scope, method, country, buyer areas, procurement categories, assignee, deadline, and comments.
Benefit: Enhances data accuracy and user confidence by providing clear guidance and structured input fields.
Clear Workflow and Step-by-step process bar
Feature: Step-by-step navigation through Context, Activity Input, and Summary.
Benefit: Ensures user compliance with the process, minimising errors.
Detailed and Granular Data Input
Feature: Specific inputs for mobile source types, vehicle types, and activity quantities.
Benefit: Provides precise data for accurate emission calculations.
Comprehensive Summary and Verification
Feature: Detailed review of all data inputs before submission.
Benefit: Ensures data completeness and accuracy.
The outcome
The newly introduced Activity-Based Calculator accurately assesses and manages carbon emissions with a user-friendly interface, enabling Eivee to implement effective and targeted emission reduction strategies. The intuitive design enhances usability and ensures reliable carbon accounting, contributing to Eivee’s sustainability goals.


